

The urgent problem engineers face
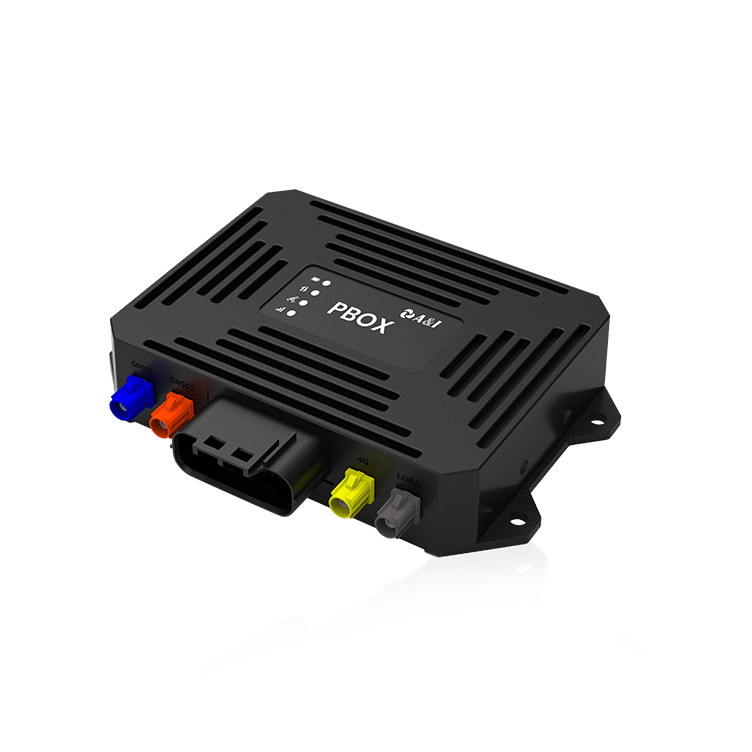
Small, cheap MEMS inertial sensors promise big capabilities, but uncontrolled noise ruins system-level accuracy when you depend on them for precise positioning. In field tests—from drone inspections to centimeter-class surveying in the San Francisco Bay Area—engineers see drift that breaks sensor fusion chains. Practical metrology is the fix: stable measurement rigs, the right statistical tools, and clear noise budgets. Start with the navigation board concept and you steer the rest of the work toward reproducible results.
Why Allan variance and noise density matter
Allan variance quantifies time-domain noise types that standard variance misses; noise density (PSD) shows frequency-domain power. Together they reveal white noise, flicker noise, and bias instability—terms that translate directly into Kalman filter tuning and expected drift over tau. These metrics are industry staples in metrology labs and appear alongside guidance from standards bodies and test labs that evaluate timing and inertial systems.
A compact measurement blueprint
Follow a repeatable sequence rather than improvising. Use a temperature-controlled chamber or at least thermal shielding. Record long, contiguous samples at fixed sampling frequency; avoid intermittent logging. Compute Allan deviation across tau decades, and compute PSD to extract noise density in units like µg/√Hz or °/s/√Hz. Track bias instability from the Allan minimum and obtain random walk coefficients from the PSD slope.
Concrete steps:
– Mount the sensor rigidly and isolate vibrations.
– Warm up electronics; let bias settle for the duration of your planned run.
– Sample at a known Fs and store raw data with timestamps.
– Use an Allan variance library or script, validate with synthetic white-noise to verify the tool.
Common mistakes and how to avoid them
Many teams rush to postprocess without establishing a controlled environment—bad idea. Short records hide low-frequency flicker and bias instability. Decimating without anti-alias filters corrupts PSD. And logging with variable timestamps destroys Allan calculations. The remedy is simple: longer runs, fixed Fs, documented setup, and sanity checks against known references—like a calibrated rate table or a precision turntable.
One more note—don’t mix units midstream. Convert everything to consistent SI units before fitting lines to Allan slopes. Mistakes here are subtle but costly.
Alternatives, fusion, and real-world anchoring
PSD and time-domain statistics complement one another; neither alone gives the whole picture. For systems that must work with GNSS, integrate the inertial noise characterization into the state estimator and tune process noise accordingly. In applied projects—centimeter-level RTK surveying and vehicle testing around San Francisco—teams that align Allan-derived parameters with GNSS latency and outage models get far better resilience during brief signal loss. The real-world anchor: survey and autonomy teams in the Bay Area routinely rely on such fusion to maintain positional trust during urban canyon maneuvers.
Common alternative checks include Allan variance of temperature-driven bias, and Monte Carlo runs of the filter using extracted noise parameters. These steps expose brittle assumptions early—so you fix models before field deployment.
Practical tips for implementation
Treat metrology like debugging a control loop: isolate one variable at a time, document every fixture and cable, and archive raw traces. Validate your workflow with a known good sensor or synthetic noise source. Use both Allan slopes and PSD to cross-check coefficients. Automate plots and summary tables to reduce human error during iterative sensor selection.
Three golden rules for high-fidelity sensor R&D
1) Prioritize measurement duration: capture low-frequency behavior; double your run length when in doubt. Longer records reveal bias instability and flicker—stuff that bites during GNSS outages.
2) Match metrics to the estimator: translate Allan minima and noise density into process-noise covariance for your Kalman filter. If you can’t convert units cleanly, revisit the math before deployment.
3) Reproduce and document: the exact mounting, temperature, and sampling details matter. Save configuration files and raw logs so later teams can reproduce the Allan curves—this saves weeks of guesswork.
These rules turn raw lab work into reliable performance on the street. For teams building resilient navigation stacks, practical metrology is the bridge between sensor datasheets and field truth—an approach embodied in tools and workflows from Archimedes Innovation. —
