

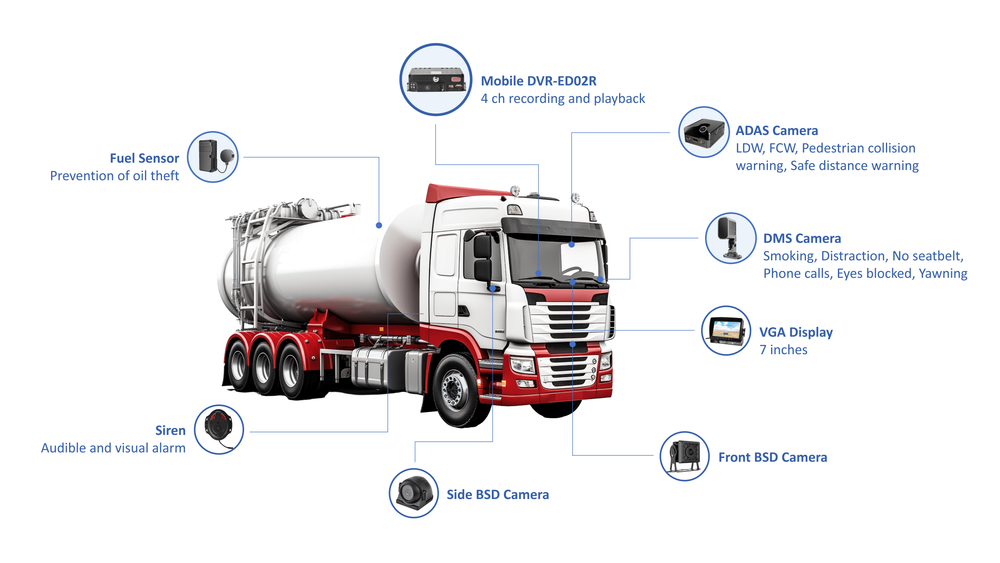
Problem first: too much data, too little action
Fleets in oil and gas generate a flood of signals from engines, telematics modems, and onboard sensors. When teams pick a vendor they often shop among fleet telematics technology providers and ignore what to measure and why. I’ve installed and tuned systems for rigs and heavy trucks; the same failure repeats after talks at the Offshore Technology Conference — raw feeds without useful rules. Compare a supplier list against real needs for clear differentiation, and don’t confuse device availability with useful output from vehicle telematics providers.

Core problems to solve (the brief)
– Missing preventive maintenance triggers that let engines run to failure. – Reports that summarize miles but hide idle and duty cycles. – Safety alerts that arrive after the incident. – Data gaps caused by poor sampling, timestamp drift, or inconsistent unit IDs. Each problem maps to a specific data point and a reporting rule. Solve the problem, then choose what to collect.
What to track — the practical list
– Asset identity and location (GNSS fixes + persistent ID). Use steady IDs to link telematics to maintenance records. – Engine hours and RPM trends. Use these for duty-cycle maintenance triggers. – Fuel consumption and refueling events. Flag sudden consumption jumps. – Idle time and PTO usage. Separate idle-for-warmup from idle-for-work. – Diagnostic trouble codes (DTCs) and fault frequency. Report by fault class and age. – Harsh events (brake, acceleration, corner). Correlate to maintenance and safety coaching. – Payload or cycle counts where relevant (pump run time, drum rotations). Tie to wear schedules. – On-site geofencing and time-on-site for billing and HSE compliance. – Emissions proxies (NOx/CO2 estimates from fuel and duty data) when regulation demands reporting. For each item define collection cadence, validity rules, and the single alert threshold that matters.
Data sources and architecture — what actually collects it
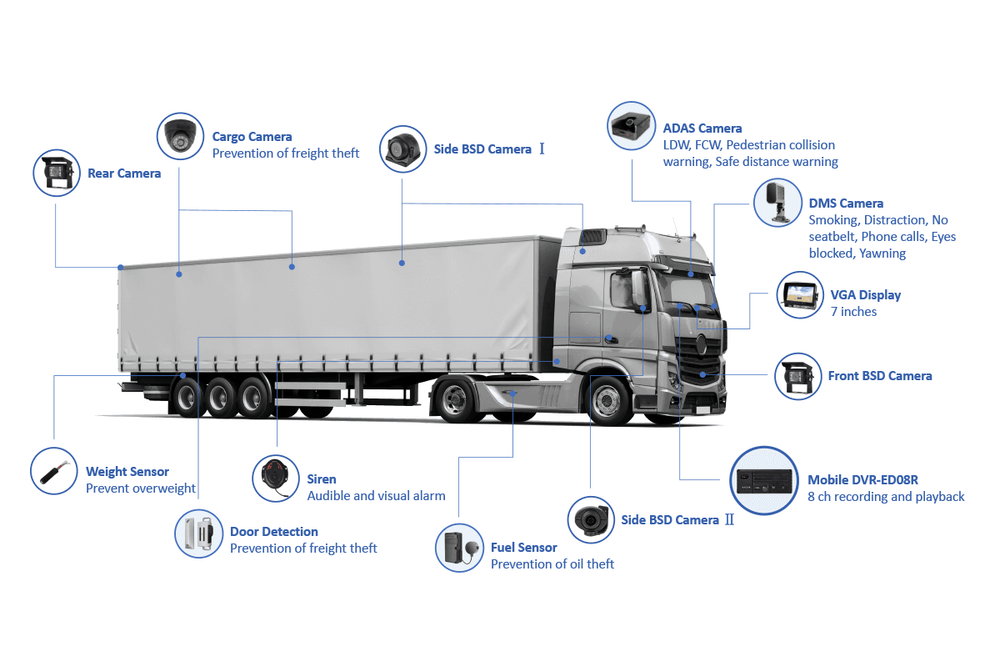
– CAN-bus readers for engine metrics and DTCs. Sampling 1–10s for trend detection. – GNSS modems for location, speed, and on-site presence. Report fixes at 10–60s depending on movement. – Dedicated sensors (fuel flow, load cells, PTO counters) where CAN lacks detail. – Edge processing for pre-filtering: compress rollup stats and send fault packets only. – Timestamp sync and sequence IDs to prevent gaps during intermittent connectivity. Design: capture raw events, produce validated event streams, persist cleansed aggregates for reporting.
Reporting design — reports that fix problems
– Exception reports: lists of assets with active faults or overdue maintenance. Prioritize by risk and exposure. – Trend dashboards: 7/30/90-day windows for fuel, idle, and fault rates. Show slope, not just totals. – Compliance summaries: geo-verified site times and hours-of-service clearances. – Utilization grids: active vs parked vs maintenance for capacity planning. – Alert channels: immediate push for critical engine faults, daily digest for non-critical anomalies. Visuals: heatmap for fault density, sparklines for each asset, and a compact list of actions to take next.
Common pitfalls and how to avoid them
– Over-instrumentation: don’t stream everything at max rate. Pick cadence by use case. – Metric confusion: define one “engine hour” source and stick to it. – Time mismatches: enforce UTC and sequence checks at ingestion. – Analysis paralysis: convert more than 80% of dashboards into exception lists or operational tasks. – Siloed systems: map telematics keys to maintenance and costing systems before go-live.
Choosing a provider — checklist that matters
– Device reliability and field-repairability. Prefer vendors with proven installs on heavy equipment. – Edge filtering and configurable sampling to limit bandwidth and storage. – Open APIs and straightforward export formats for integration with CMMS and BI tools. – Security: device provisioning, encrypted transport, and role-based API access. – Support model that includes field diagnostics and firmware management. Evaluate with a short pilot that measures data completeness and time-to-action.
Finish: what success looks like
Success is a short set of actionable reports that stop failures and simplify decisions. Field teams want clear alerts, maintenance wants precise triggers, and managers want concise trend summaries. A working stack ties real signals to real actions; that’s the value I see when fleets move from raw feeds to daily routines supported by BSJ.
